
Publish Vegeta Test Results To InfluxDB 2.0 (Flux Language)
In my previous article, I have shown How to publish Vegeta test results into Grafana using ELK Stack. In the previous approach, Vegeta client sends the final test result (at every 10 ms as JSON file) to the Elasticsearch. But now Vegeta client send selected raw data for EACH request to the InfluxDB. This is an advantage where we can do further analysis of our performance test results.
In this post, I will discuss how to publish Vegeta test results to InfluxDB 2.0.
Let’s start now. Following are steps which you need to follow:
- Integrate InfluxDB into Vegeta script
- Set up InfluxDB 2.0
- Create a Dashboard in Grafana
Proposed solution:

Step 01: Integrate InfluxDB into Vegeta script
Use the InfluxDB Go client library to integrate InfluxDB into Go script. Here I used Non-blocking write client which uses implicit batching. Data are asynchronously written to the underlying buffer and they are automatically sent to a server when the size of the write buffer reaches the batch size, default 5000, or the flush interval, default 1s, times out. Writes are automatically retried on server backpressure.
package main

import (
    "fmt"

    "github.com/influxdata/influxdb-client-go/v2"
)

func main() {
   applicationName := "bucket-name" // Bucket name. Do not use values starting with underscore (_)
organizationName := "org-name"   //Org name
token := "example-token"
// Store the URL of your InfluxDB instance
url := "http://localhost:8086"

// Create a new client using an InfluxDB server base URL and an authentication token
client := influxdb2.NewClientWithOptions(url, token, influxdb2.DefaultOptions().
   SetUseGZip(true).SetBatchSize(100000))
// Get non-blocking write client
writeAPI := client.WriteAPI(organizationName, applicationName)
// Get errors channel
errorsCh := writeAPI.Errors()
// Create go proc for reading and logging errors
go func() {
   for err := range errorsCh {
      fmt.Printf("write error: %s\n", err.Error())
   }
}()

transactionName := "GET Request" //measurement name
// write some points
// create point
p := influxdb2.NewPointWithMeasurement(transactionName).
   AddField("code", res.Code).
   AddField("latency", res.Latency.Nanoseconds()).
   AddField("bytes_out", strconv.Itoa(int(res.BytesOut))).
   AddField("bytes_in", strconv.Itoa(int(res.BytesIn))).
   SetTime(time.Now())
// write asynchronously
writeAPI.WritePoint(p)

// Force all unwritten data to be sent
writeAPI.Flush()
// Ensures background processes finishes
client.Close()
}
I uploaded the fully functional source code to my GitHub repository.
Step 02: Set up InfluxDB 2.0
To install InfluxDB V2.0 in your instance, please follow this article.
The initial setup process for InfluxDB walks through creating a default organization, user, bucket, and Admin authentication token. The setup process is available in both the InfluxDB user interface (UI) and in the influx command-line interface (CLI).
Begin the InfluxDB setup process via the influx CLI by running:
influx setup- Enter a primary username.
- Enter a password for your user.
- Confirm your password by entering it again.
- Enter a name for your primary organization.
- Enter a name for your primary bucket.
- Enter a retention period for your primary bucket — valid units are nanoseconds (
ns), microseconds (usorµs), milliseconds (ms), seconds (s), minutes (m), hours (h), days (d), and weeks (w). Enter nothing for an infinite retention period. - Confirm the details for your primary user, organization, and bucket.
InfluxDB is now initialized with a primary user, organization, bucket, and authentication token. InfluxDB also creates a configuration profile for you so that you don’t have to add organization and token to every command. To view that config profile, use the influx config list command.
View authentication tokens using the InfluxDB command-line interface (CLI).
influx auth listStep 03: Create a Dashboard in Grafana
With InfluxDB 2.0, we can use Flux language. Flux is a standalone data scripting and query language that increases productivity and code reuse. It is the primary language for working with data within InfluxDB 2.0. Flux can be used with other data sources as well, letting you work with data where it resides.
Now we need to add a new DATA source in Grafana. Please refer to the following image.
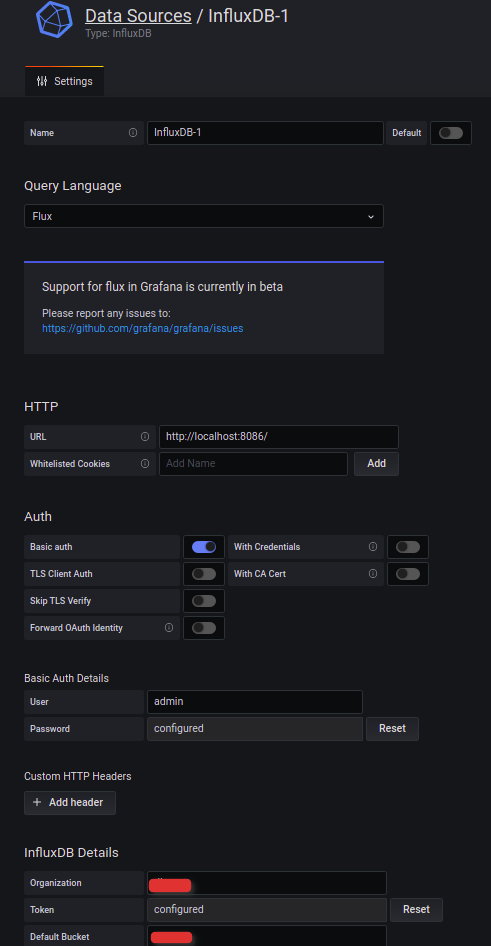
Once you create a DATA source, then you can start creating your own Dashboard panels.
Following is a sample Flux query which you will find in the dashboard. You can find a well-documented User Guide here.
from(bucket: "${application}")|> range(start: v.timeRangeStart, stop: v.timeRangeStop)|> filter(fn: (r) => r._measurement == "${transaction}" and r._field == "latency")|> count()|> rename(columns: {_value: "Total Request"})|> yield(name: "Total Request")
You can import the Grafana Dashboard which I have created by using Flux queries.
Now let’s see the practical usage of this solution.
Test Details
- Duration: 30 minutes
- Transactions per second (TPS): 800
- HTTP Method: GET
- Response Payload: 50 KB
- InfluxDB version: 2.0.4 [Please make sure to get the latest version]
- Grafana Version: 7.4.1 [Please make sure to get the latest version]
Oops.. :(
You will also get this issue with the default setting of Grafana and InfluxDB.
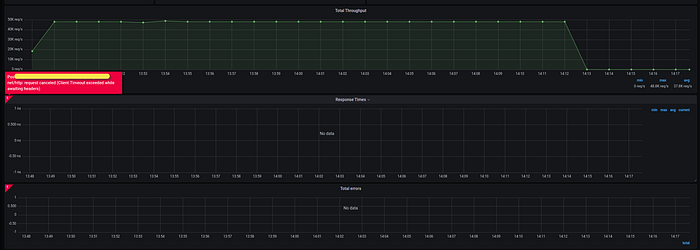
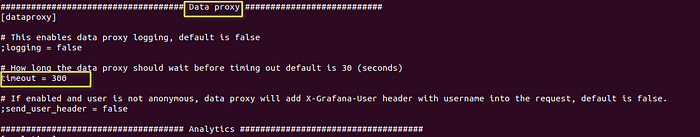
Since Grafana process 1.44 million requests, the time taken to query the data will exceed default Grafana timeout (30 s). So you need to change the default time out to 300 seconds. Change the Grafana configuration file as follow,
The number of queries allowed to execute concurrently in InfluxDB is 10. Since the Dashboard uses more than 10 queries you need to change the default settings. Copy and paste the following command. Make sure you restart InfluxDB in order to get the effect of the new change.
export INFLUXD_QUERY_CONCURRENCY=25With the above tunings, you can run your GO script now.
go run main.goFinally, you can view your Vegeta test results in Grafana as follow,

AWS Application Load Balancer (ALB) details during the test,

Here are the resources which you need to try this out from your own environment.
- Complete source code for publishes Vegeta test data into InfluxDB. This script also prints the error responses which occurred during the test. These errors can be used for further analysis.
- A Grafana Dashboard which was created using Flux query language, where you can export into your Grafana. [Download the Dashboard.]
I hope you find this blog useful when you use Vegeta tool. If you have any questions, please post them here. Thanks!